Case study
YieldPro
A crop-monitoring platform built from scratch: field subscriptions in PostGIS, Airflow pipelines that produce per-field crop-health reports, vector tiles served from the database, and an Angular map interface.
- Result
- $200K+ in revenue and 50K+ farmers served.
- Stack
- GoPostGISApache AirflowAngularMapbox GLAWS
Context
Agribusinesses and their growers need to know which fields need attention without visiting every one. YieldPro turns satellite imagery into crop-health maps and regular reports for each subscribed field.
How it works
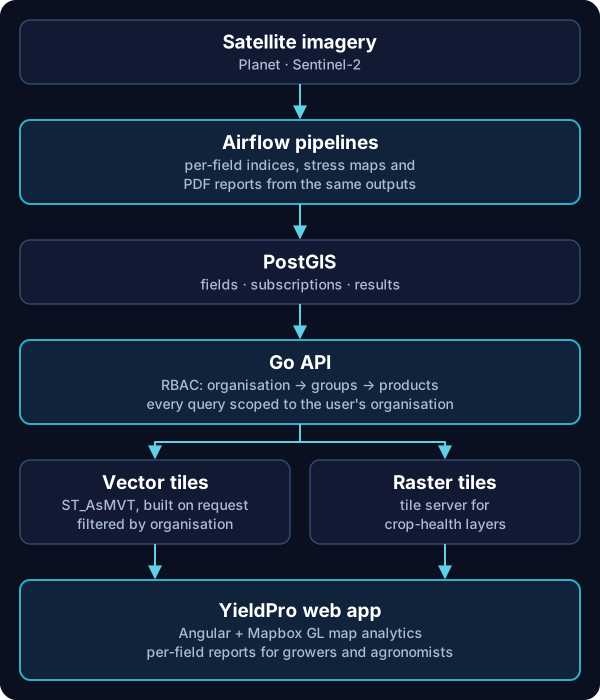
Fields and subscriptions live in PostGIS. Airflow pipelines compute indices and stress maps for each field, load results into the database and render PDF reports.
The Go API serves the data and the map. Vector tiles are generated on request in PostGIS (ST_AsMVT) and filtered by the user's organisation, and raster layers come from a tile server. The web app is Angular with Mapbox GL.
Key decisions
Generate vector tiles in the database
Building tiles in PostGIS on request means the map always shows current data and every tile is filtered by organisation. There is no pre-built tile set to rebuild or to leak between customers.
Access control by product and organisation
I introduced role-based access control: users belong to groups within an organisation, and groups grant access to products. The same model now covers every Farmdar product.
Reports from the same pipeline as the map
PDF reports are rendered from the pipeline's own outputs, so what a grower reads matches what they see on the map.
My role
I led YieldPro's development as Software Engineer II. I built the RBAC model, the PostGIS tile server and the Angular map app, which cut user task completion time by 50%.
Next case study
Unified Go backend and Cognito sign-in →