Case study
Crop intelligence: from models to products
CropScan in progress
The engineering that turns crop models into products: the FAO crop-pattern planning platform, a pixel-level corn and soybean yield pipeline, and CropScan, which I'm building now.
- Result
- Models built by the data science team run as scheduled pipelines and ship to clients and the FAO as products, not notebooks.
- Stack
- FastAPIAngularPostGISApache AirflowGoogle Earth EngineTensorFlow
Context
Farmdar's data scientists build the models: crop classification, yield prediction and evapotranspiration. Getting them to customers needs data pipelines, storage, APIs and interfaces around them. That is the part my team owns.
How it works
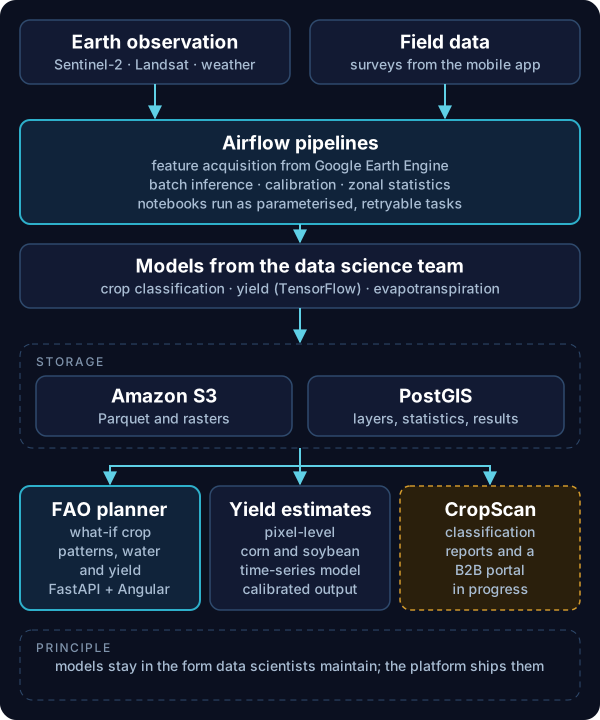
FAO crop-pattern planning tool: planners in Punjab and Sindh test what-if crop patterns and see the effect on water demand, water shortage, yield and water productivity, including climate projections. The platform is a FastAPI service for layers, statistics, scenarios, projections, validation and export; Airflow DAGs for ingest and zonal statistics; crop-map storage at the delivered 10 m resolution; and per-crop validation metrics.
Corn and soybean yield: a pixel-level time-series network in TensorFlow, with a data and inference pipeline around it covering feature acquisition from Google Earth Engine (Sentinel-2, Landsat, weather), moving storage to S3 and Parquet, logged and error-handled batch prediction, and applying calibration factors to outputs.
CropScan (in progress): I'm building CropScan's production pipeline as Airflow DAGs that turn crop classification outputs into area statistics, map tilesets and client report packages, with a B2B portal on top.
Key decisions
Pipelines around notebooks, not rewrites
Model code stays in the form the data scientists maintain. The platform runs it with parameters, on the right hardware, and stores outputs where the API can serve them.
Keep the delivered resolution
For the FAO tool, crop maps are stored at the 10 m resolution they were delivered at, rather than resampled, so area statistics match the source maps.
Validation is a feature
The FAO tool shows per-crop accuracy metrics next to the maps, so planners can see how far to trust each layer.
My role
I lead the team that takes these models to production: the APIs, pipelines, storage and interfaces, working with the data scientists on how their models run at scale. CropScan's pipeline is what I'm building now.
Next case study
Geospatial data lake and query layer →